The 82,137 new vehicles registered as sold across April placed it just over 1,000 units ahead of the corresponding period last year, representing a 1.3% increase, but it was lower than any month in the first quarter of 2023.
January (84,873), February (86,878) and March (97,251) were all more productive than last month, which can again be attributed in part to considerable shipping and production delays.
However, despite the mixed news for the industry, it was a big win for electric and partly electrified vehicles, which made up 8% of all sales. This is in stark contrast to the 1.1% it accounted for just 12 months ago, while all forms of electrification combined also rose from 9.5% to 15.4%.
All the growth seen across April can be put down to the increase in popularity of SUVs, which rose by 8.6% compared to 2022 to reach 46,031 and a market share of 56.0%. Light commercial vehicles continued their downward trend, falling by 13.1%, while passenger cars also dipped by 1.6%.
Meanwhile, it was positive for the heavy vehicle segment, which climbed by 6.6% to 3,855. Their YTD sales are over 2,000 ahead of where they were at the same point last year, resulting in a 16.7% increase.
There were no great movers or shakers in terms of vehicle sales by state or territory, with Tasmania (1,271, -13.3%) and the Northern Territory (761, -10.3%) the only regions whose numbers fluctuated by over 7% either way.
Western Australia (8,303, +5.2%), the ACT (1,261, +5.0%), Queensland (18,188, +4.4%) and Victoria (22,226, +4.2%) all saw modest growth, while South Australia (5,087, -6.8%) and New South Wales (25,040, -1.5%) also dropped.
Market sales: April 2023
| Category | April sales | % change vs 2022 | Market share % |
| SUV | 46,031 | 8.6 | 56.0 |
| Light commercial | 17,060 | -13.1 | 20.8 |
| Passenger | 15,191 | -1.6 | 18.5 |
| Heavy commercial | 3,855 | 6.6 | 4.7 |
Vehicle sales by state or territory: April 2023
| State/territory | April sales | % change vs 2022 |
| New South Wales | 25,040 | -1.5 |
| Victoria | 22,226 | 4.2 |
| Queensland | 18,188 | 4.4 |
| Western Australia | 8,303 | 5.2 |
| South Australia | 5,087 | -6.8 |
| Tasmania | 1,271 | -13.3 |
| Australian Capital Territory | 1,261 | 5.0 |
| Northern Territory | 761 | -10.3 |
Vehicle brands: April

It was another month of misery for Toyota, who continued to be hit hard by delays to register only 12,090 vehicles sold across April. This represents a massive 33.0% drop compared to last year, making it the second successive month of significant decline after the 39.4% decrease seen in March.
Despite this, though, the Japanese giant still led all comers by some distance, with Mazda being the next-best in terms of sales with 6,929, albeit also at a loss of 6.1% compared to 2022.
We also saw the first change in the podium positions for 2023, with Ford sliding to fifth and being replaced by Kia, whose 6,200 vehicles sold (+0.3%) were enough to snatch third place ahead of Hyundai (5,732, +3.2%) and the American manufacturer (5,047, +1.5%), who rounded out the top five.
Elsewhere, it was a big month for Tesla, whose 3,676 vehicles sold moved it into seventh for the month and continues to lead the way for electric cars in Australia. Meanwhile, Mitsubishi slid out of the top five off the back of another disappointing month, with the 4,440 units sold being 31.3% fewer than last April.
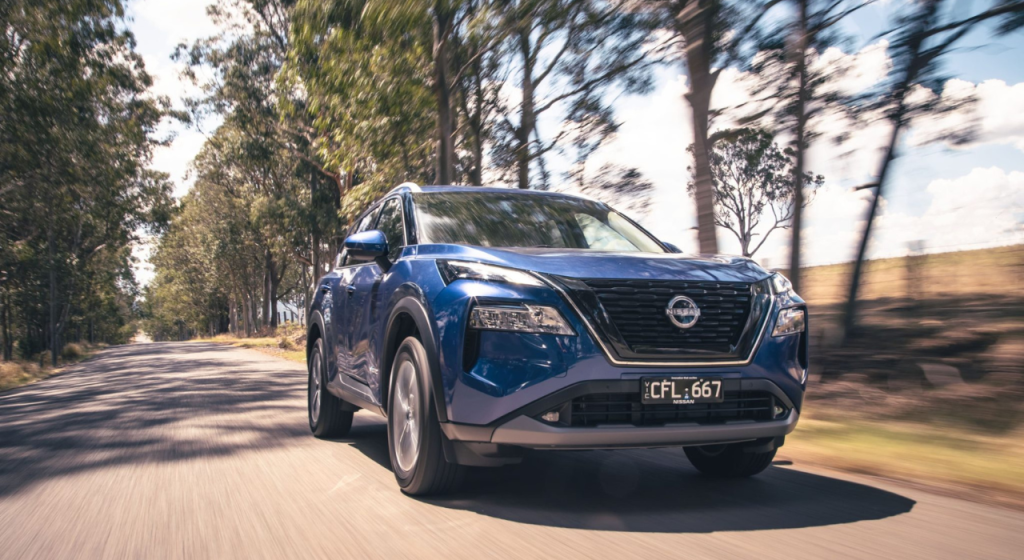
Nissan and Volkswagen both rose into the top ten with solid monthly performances, recording 3,009 (+46.8%) and 2,957 (+71.8%), respectively to round out the best-sellers list.
In terms of YTD sales, Toyota remains on top, albeit over 30% behind its sales from the same point last year, while Kia replaced Ford in the top three and Tesla overtook Subaru to move into eighth overall.
Best-selling vehicle brands: April 2023
| Brand | April sales | % change vs 2022 |
| Toyota | 12,090 | -33.0 |
| Mazda | 6,929 | -6.1 |
| Kia | 6,200 | 0.3 |
| Hyundai | 5,732 | 3.2 |
| Ford | 5,047 | 1.5 |
| Mitsubishi | 4,440 | -31.3 |
| Tesla | 3,676 | >999 |
| MG | 3,463 | -27.4 |
| Nissan | 3,009 | 46.8 |
| Volkswagen | 2,957 | 71.8 |
| Isuzu Ute | 2,904 | -4.2 |
| Subaru | 2,511 | 52.7 |
| GWM | 2,216 | 63.8 |
| Mercedes-Benz | 2,131 | -7.6 |
| BMW | 1,750 | 5.2 |
Best-selling vehicle brands: YTD 2023
| Brand | 2023 sales | % change vs 2022 |
| Toyota | 52,947 | -30.3 |
| Mazda | 32,243 | -13.4 |
| Kia | 24,609 | 4.1 |
| Ford | 24,178 | 31.7 |
| Hyundai | 22,414 | -1.9 |
| Mitsubishi | 21,079 | -29.3 |
| MG | 15,848 | -1.2 |
| Tesla | 14,083 | 215.1 |
| Subaru | 14,018 | 43.1 |
| Isuzu Ute | 13,265 | 12.1 |
Vehicle models: April

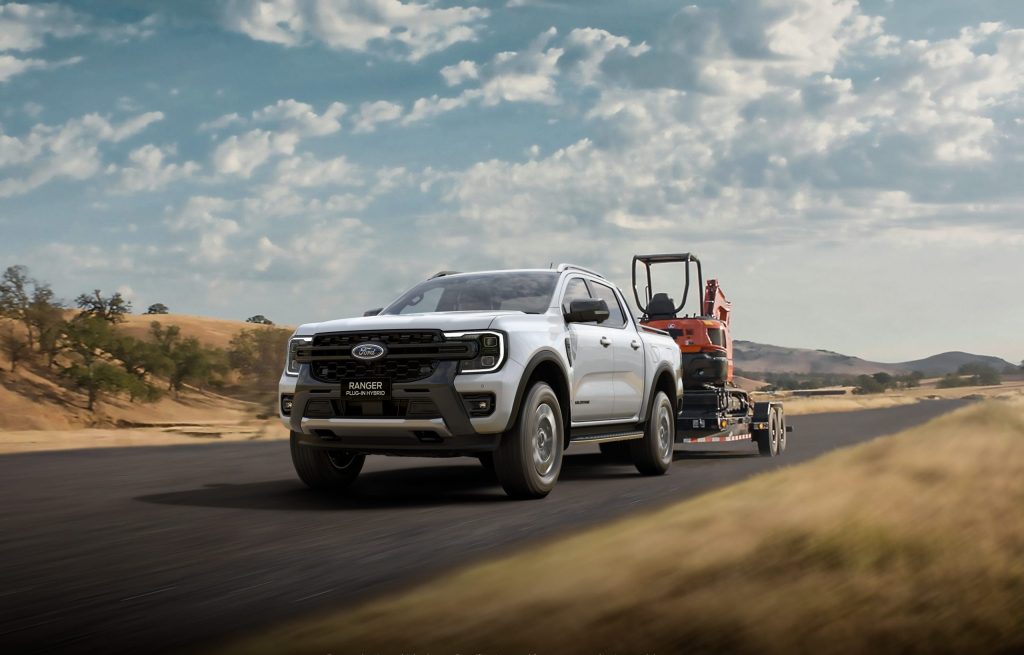
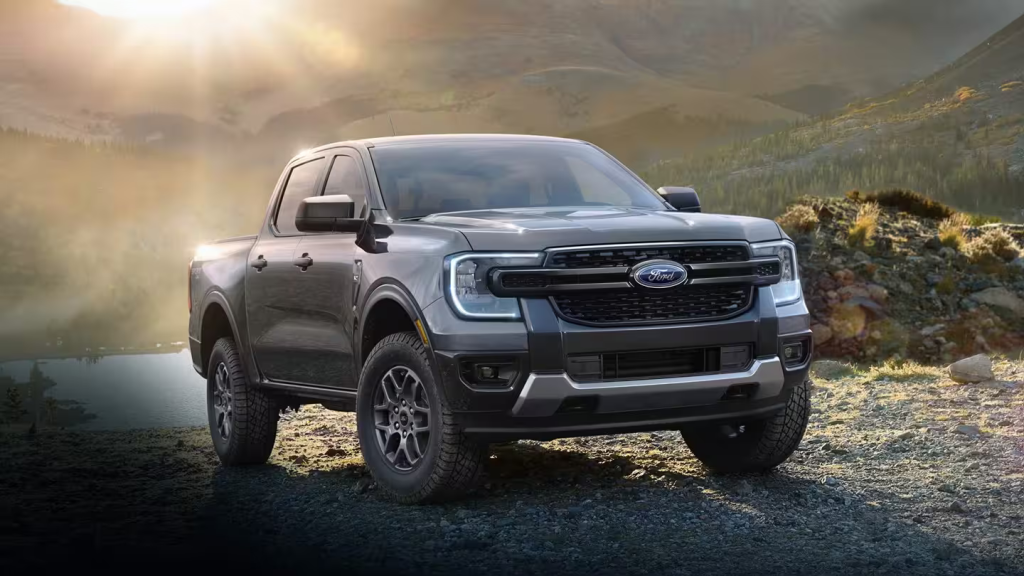
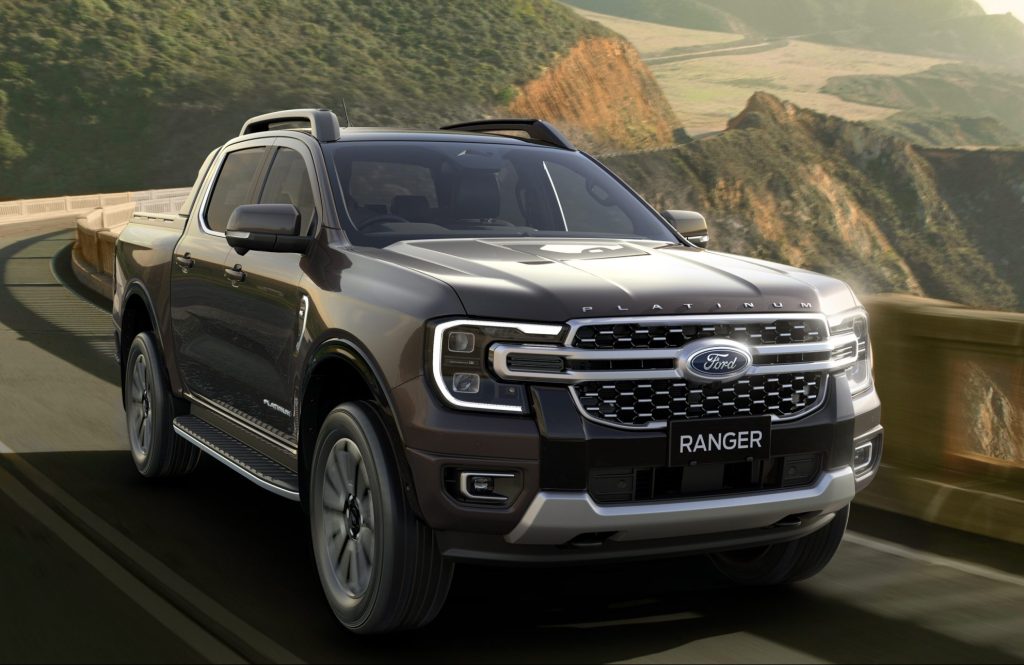
The Ford Ranger wrestled back top spot from the Toyota HiLux for best-selling vehicle models, pipping its biggest rival by just 41 units across the month to record its third monthly victory of 2023. The close result follows last month, where the HiLux beat out the Ranger by 75 new models.
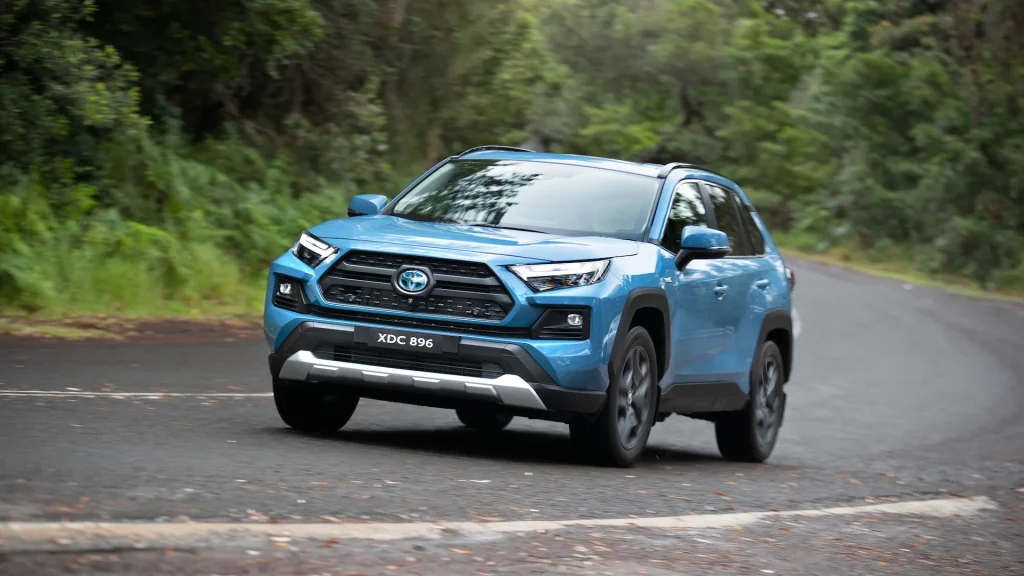
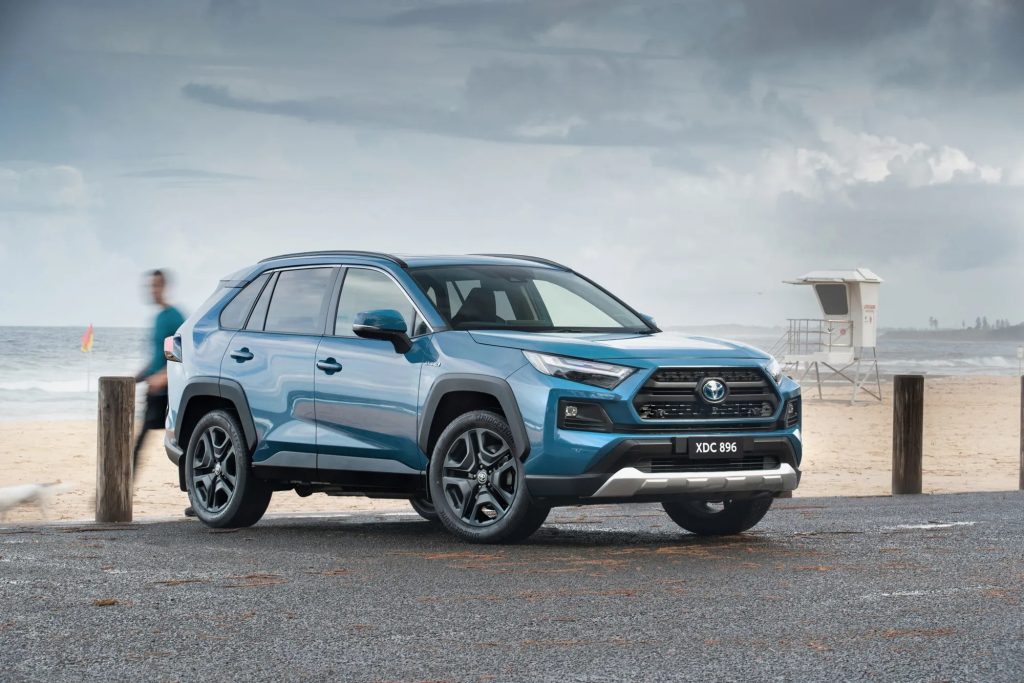
Despite topping the charts, the Ranger is slightly behind the numbers it recorded last April, with the 3,567 representing a minuscule slip of just 0.4%. Meanwhile, Toyota’s delay struggles have impacted its varying models, with the HiLux (3,526, -21.5%) and RAV4 (2,198, -34.8%) both seeing significant drop-offs in April.
Perhaps the most notable inclusions in the top ten for the month were both the Tesla Model Y and Model 3, with the former notching 2,095 registrations to sit fourth and the latter 1,581 to round out the top ten. Both models saw massive improvements on the same month last year when they sold a combined 52 vehicles.
The Hyundai i30 moved into the top five after failing to make the top ten at all last month, with its 2,029 models still 2.0% behind last year. However, two models which saw substantial improvement were the Mitsubishi Outlander (1,829, +68.4%) and Hyundai Tucson (1,678, +90.2%).
The Isuzu Ute D-Max, which finished third in March, slid to seventh after recording 1,809 new sales at a rate 23.8% below that of 2022, while the MG ZS (1,588, -17.4%) also experienced a decline last month.
Despite being the second-most popular make in Australia across April, none of Mazda’s models reached the top ten for the month, with the CX-30 (1,291, +9.9%) and CX-5 (1,243, -54.0%) finishing 12th and 13th, respectively.
In terms of YTD sales, the Ranger remains out in front with 17,297 (+30.6%) ahead of the HiLux (16,179, -15.8%), Model 3 (8,819, +97.3), D-Max (8,372, -3.2%) and RAV4 (8,049, -41.9%).
Best-selling vehicle models: April 2023
| Model | April sales | % change vs 2022 |
| Ford Ranger | 3,567 | -0.4 |
| Toyota HiLux | 3,526 | -21.5 |
| Toyota RAV4 | 2,198 | -34.8 |
| Tesla Model Y | 2,095 | N/A |
| Hyundai i30 | 2,029 | -2.0 |
| Mitsubishi Outlander | 1,829 | 68.4 |
| Isuzu Ute D-Max | 1,809 | -23.8 |
| Hyundai Tucson | 1,678 | 90.2 |
| MG ZS | 1,588 | -17.4 |
| Tesla Model 3 | 1,581 | >999 |
Best-selling vehicle models: YTD 2023
| Brand | 2023 sales | % change vs 2022 |
| Ford Ranger | 17,297 | 30.6 |
| Toyota HiLux | 16,179 | -15.8 |
| Tesla Model 3 | 8,819 | 97.3 |
| Isuzu Ute D-Max | 8,372 | -3.2 |
| Toyota RAV4 | 8,049 | -41.9 |
| Mazda CX-5 | 7,949 | -27.4 |
| Mitsubishi Outlander | 7,838 | 36.8 |
| MG ZS | 7,321 | 1.4 |
| Hyundai i30 | 6,528 | -17.6 |
| Hyundai Tucson | 6,171 | 120.1 |
