January’s result was 11.9% greater than the 75,863 units shifted over the same month last year, according to the latest VFACTS data, placing it 0.6% above the five-year pre-pandemic average.
This makes it the sixth successive month in which vehicle sales have surpassed the previous month’s performance by more than 10%, with August (+17.3%), September (+12.3%), October (+16.9%), November (+17.9%) and December (+12.1%) all seeing positive growth.
It was a strong month for electric and hybrid vehicle sales, making up a combined 12.3% (10,426) of the total new vehicles sold in January. The Tesla Model 3 accounted for almost 3,000 of these units on its own, while the MG ZS and Mitsubishi Outlander also featured in the top ten backed by either battery electric or hybrid variants.
In terms of the different categories of vehicles, SUVs maintained a strong majority of the market share, with the 46,698 sold representing an increase of 17.9% compared to last year and making up 55.0% of the total vehicle sales for the month.
Light commercial vehicles edged past 2022’s equivalent sales by 1.6% (18,546) to hold a market share of 21.9%, while passenger vehicle sales grew by 5.5% (16,602), representing a share of 19.6.
The 3,027 heavy commercial vehicles sold in January represented a significant boost to their numbers from last January to the tune of 33.3%, with their market share now sitting at 3.6%.
Each state and territory across the country sold more vehicles than they did in January 2022, with the ACT (1,394, +18.6%), New South Wales (26,484, +15.0%) and Queensland (18,766, +14.3%) experiencing the largest percentage growth.
Market sales: January 2023
| Category | January sales | % change vs 2022 | Market share % |
| SUV | 46,698 | 17.9 | 55.0 |
| Light commercial | 18,546 | 1.6 | 21.9 |
| Passenger | 16,602 | 5.5 | 19.6 |
| Heavy commercial | 3,027 | 33.3 | 3.6 |
Vehicle sales by state or territory: January 2023
| State/territory | January sales | % change vs 2022 |
| New South Wales | 26,484 | 15.0 |
| Victoria | 22,367 | 9.7 |
| Queensland | 18,766 | 14.3 |
| Western Australia | 7,901 | 4.3 |
| South Australia | 5,786 | 11.9 |
| Tasmania | 1,510 | 2.9 |
| Australian Capital Territory | 1,394 | 18.6 |
| Northern Territory | 665 | 7.8 |
Vehicle brands: January

Toyota kicked off 2023 in the same fashion as it has done for many years, registering the most new car sales in Australia for the month with 13,363. However, despite stock shortages beginning to ease across the country, its numbers were down on last year’s January sales by 12.8%.
Mazda backed up its position as the second-most popular manufacturer in Australia across 2022 by finishing second in January 2023, with 9,407 vehicles sold representing a marginal 4.1% decrease compared to last year.
Ford’s purple patch of sales continued with another top-three finish, selling 6,624 new vehicles across the month in what was a 46.3% improvement on 2022. Kia (6,006, +8.8%) and Hyundai (5,809, +13.3%) rounded out the top five.
Inside the top ten, Subaru saw the next-largest growth behind Ford, with a 32.3% improvement (3,601) on last year’s sales, while Tesla’s ninth-placed finish is another strong return from the EV manufacturer (although its sales figures from last year aren’t publicly available).
Although they didn’t finish in the top ten, GWM and Volkswagen saw the greatest increase compared to 2022, with 115.2% and 66.5% boosts to their sales, respectively.
Mitsubishi was the most notable slider inside the top ten, failing to crack the top five and selling 19.2% fewer units than last January, while Mercedes-Benz’s 30.7% drop was the largest in the top 15 sellers.
Best-selling vehicle brands: January 2023
| Brand | January sales | % change vs 2022 |
| Toyota | 13,363 | -12.8 |
| Mazda | 9,407 | -4.1 |
| Ford | 6,624 | 46.3 |
| Kia | 6,006 | 8.8 |
| Hyundai | 5,809 | 13.3 |
| Mitsubishi | 5,276 | -19.2 |
| MG | 4,015 | 13.5 |
| Subaru | 3,601 | 32.3 |
| Tesla | 3,313 | N/A |
| Isuzu Ute | 2,671 | -1.6 |
| Volkswagen | 2,542 | 66.5 |
| GWM | 2,503 | 115.2 |
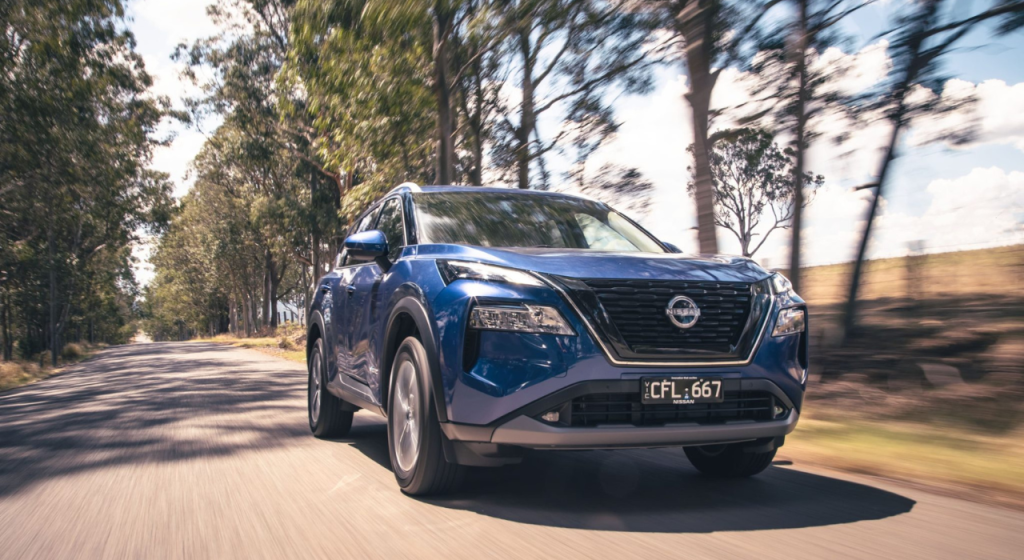
| Nissan | 2,448 | 4.9 |
| Mercedes-Benz | 1,772 | -30.7 |
| BMW | 1,480 | -5.4 |
Vehicle models: January
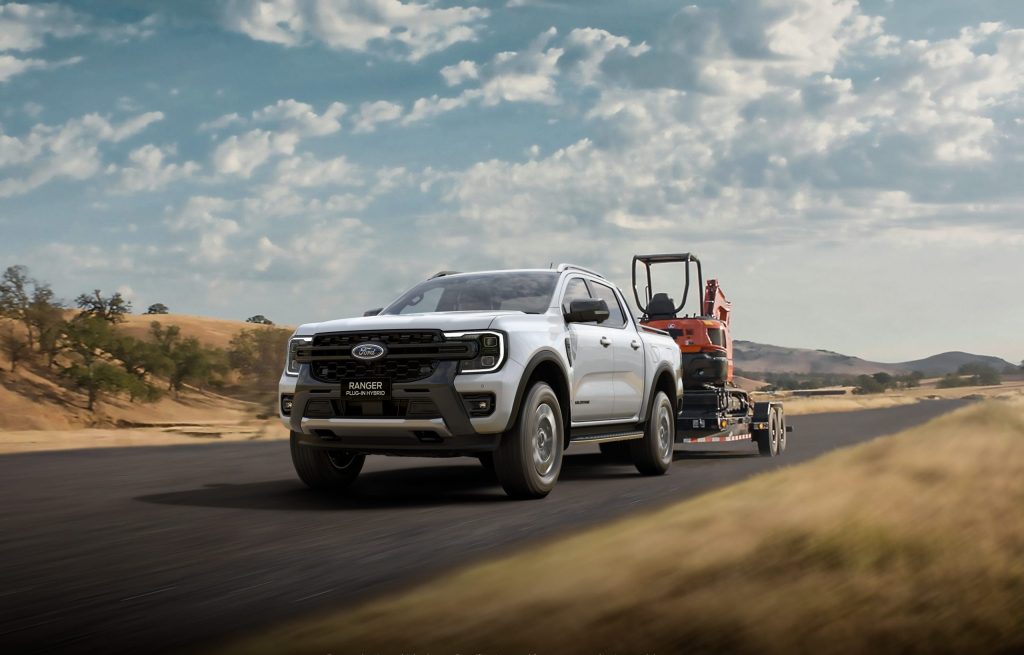
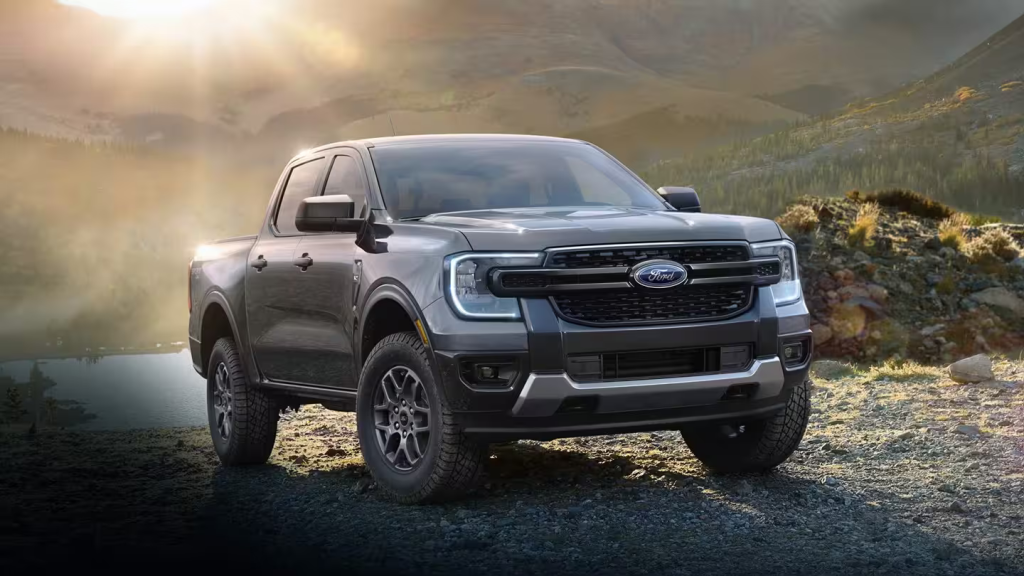
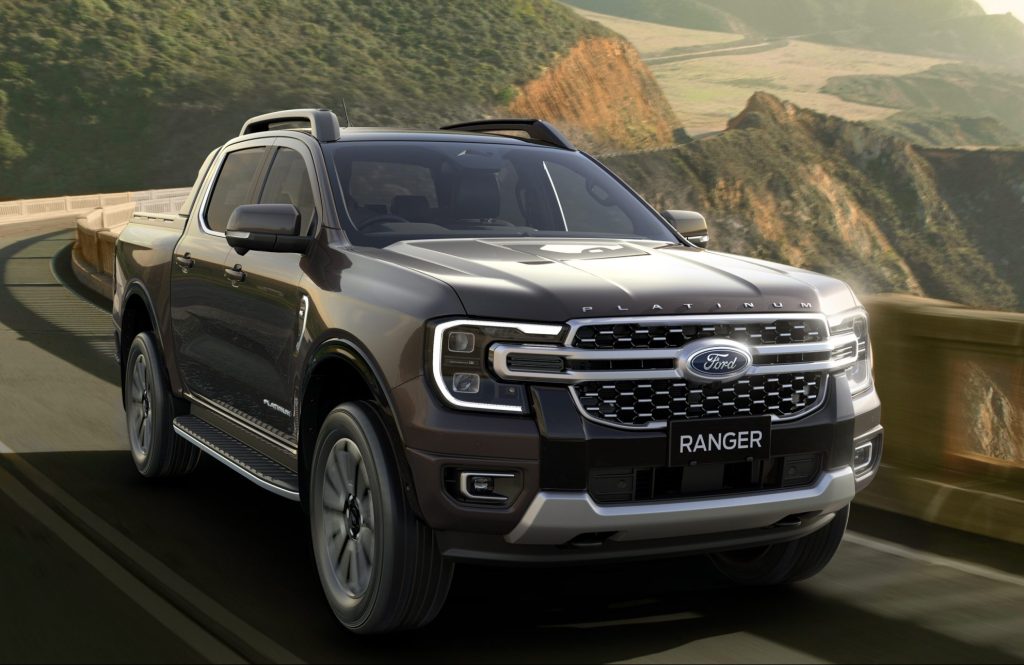
The Ford Ranger romped to first place in the best-selling vehicle model list for January, selling 4,250 across the month in what was a 42.3% increase on last year’s numbers. It also put them over 1,200 units ahead of the second-placed Toyota HiLux, which ruled the roost last year.
3,044 HiLux models were sold, which was an increase of 18.5%, but the big talking point was Tesla, who finished in third place with 2,927. It’s the first time a purely battery electric vehicle model has reached the top three best sellers in a given month, providing them with a slice of history to start the year.
Mazda’s CX-3 (2,417) and CX-5 (2,189) rounded out the top five for the month. While the CX-5’s sales were down 31.9% on last year, the CX-3’s were up by an enormous 167.1%.
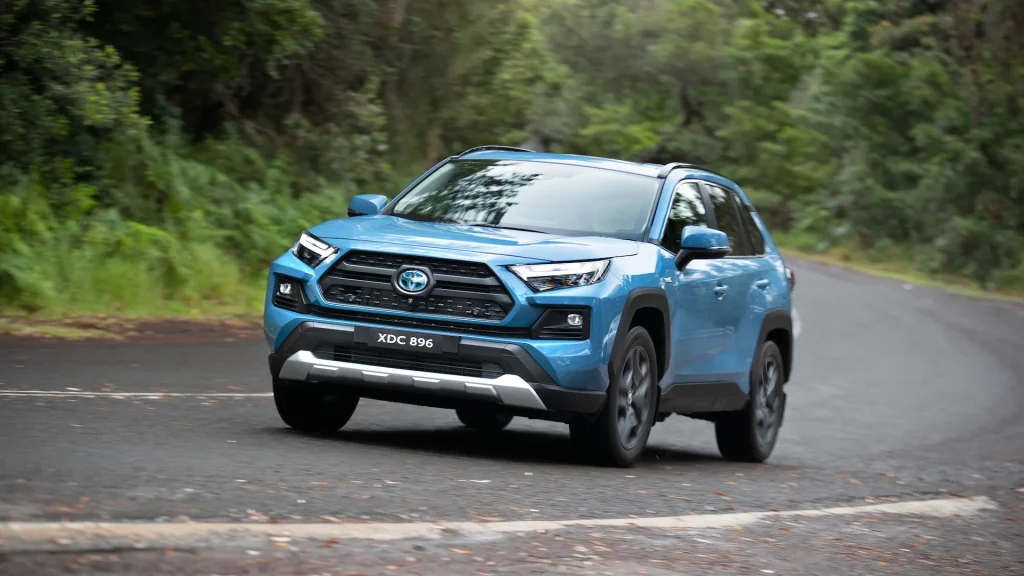
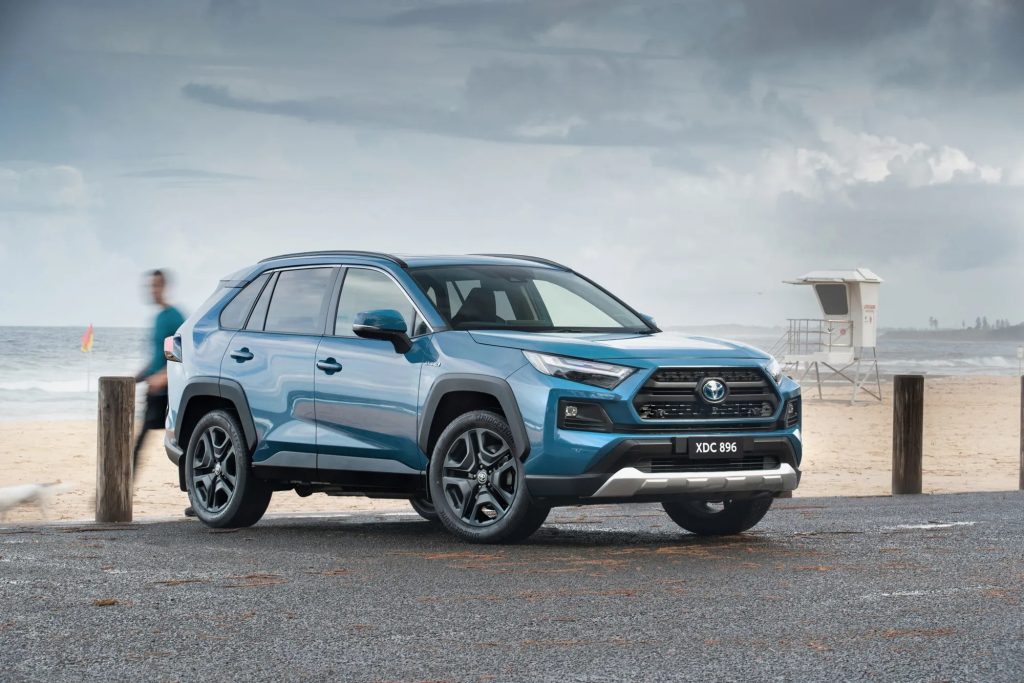
Toyota also had two models in the top ten best-sellers, with the RAV4 finishing sixth with 1,958 sold (+37.4%), while the Hyundai Tucson more than doubled its numbers recorded last year to round out the list with 1,615 new vehicles purchased (+108.4%).
The Isuzu Ute D-Max was the only vehicle aside from the CX-5 to record a lower sales figure than January 2022 (although Tesla’s numbers aren’t available), with a 2.7% drop (1,843) as it finished a solitary vehicle ahead of the eighth-placed MG ZS (1,842, +16.0).
Best-selling vehicle models: January 2023
| Model | January sales | % change vs 2022 |
| Ford Ranger | 4,250 | 42.3 |
| Toyota HiLux | 3,044 | 18.5 |
| Tesla Model 3 | 2,927 | N/A |
| Mazda CX-3 | 2,417 | 167.1 |
| Mazda CX-5 | 2,189 | -31.9 |
| Toyota RAV4 | 1,958 | 37.4 |
| Isuzu Ute D-Max | 1,843 | -2.7 |
| MG ZS | 1,842 | 16.0 |
| Mitsubishi Outlander | 1,674 | 23.8 |
| Hyundai Tucson | 1,615 | 108.4 |
